
Knowing how method performance impacts out-of-specification rates may improve quality risk management and product knowledge.
To control the consistency and quality of pharmaceutical products, analytical methods must be developed to measure critical quality attributes (CQAs) of drug substance/drug product. Analytical method accuracy/bias and precision are always in the path of drug evaluation and associated acceptance/failure in release testing. The following are three equations that show how the analytical method is always influencing the quantitation of drug substance/product (Equations 1–3):

Product Mean = Sample Mean + Method Bias
[Eq. 2]
Reportable Result = Test sample true value + Method Bias + Method Repeatability
[Eq. 3]
Knowing what is the allowable contribution of the method error in drug performance becomes crucial when building product knowledge, process understanding, and the associated long-term product lifecycle control. Mathematically, the variation of any drug product or drug substance is the additive variation of the method and test sample being quantitated.
Generally, to control the quality of a product and to manage drug safety and efficacy, there are two key elements: cinical trials evaluting the pharmacokinetics (PK) response to drug product and dose and specification limits (1) of drug product and drug substance once clinical trials have demonstated the drug to be safe and effective. This logic is essentially laid out in two guidance documents: International Council for Harmonization (ICH) Q6B Specifications and ICH Q9 Quality Risk Management (2).
Clearly defined method acceptance criteria that evaluate the goodness and fitness of an analytical method for its indended purpose are mandatory to correctly validate an analytical method and know its contribution when quantitating product performance or releasing a batch. Methods with excessive error will directly impact product acceptance out-of-specification (OOS) rates and provide misleading information regarding product quality.
Traditional Measures of Analytical Goodness and History
Historically, analytical chemists have worked on the science of an analytical method and maintained their evaluations of method goodness independent from the product they intend to evaluate. Traditional measures of analytical goodness include the following:
• % coefficient of variation (CV) = (repeatability/mean)*100
• % recovery = (measured concentration/standard concentration)*100
• R-square of a curve comparing the theoretical concentration to the signal from the method.
This strategy has its advantages and its drawbacks. The advantage is the lab can develop and evaluate the goodness of a method independent of the product and the associated acceptance criteria it is intended to measure. This is particularly of interest during early development when product specification limits (Q6B) are not yet available. The penalty for solely depending on CV or % recovery is a method may be developed and qualified without knowing if it is fit-for-purpose or fit-for-use, and knowing its associated influence on product acceptance and release testing. Further, the traditional approach will often falsely indicate a method is performing poorly at low concentrations, when in fact it is performing excellently. Conversely, at high concentrations, the method will often appear to be performing well—as the % CV and % recovery appear to be acceptable—when it is actually unacceptable relative to the product specification limits it will be used to evaluate.
Closing the Gap
The % relative standard deviation (RSD)/% CV and % recovery should be report-only and should be included in any evaluation of an analytical method per ICH Q2 (3). Measurements that are relative to some theoretical concentration should never be used in establishing acceptance criteria for an analytical method except when specifications are not available and should be reevaluated when they are. In practice, no company will release to the clinic or to the market the mean or theoretical concentration; one releases every batch, tablet, vial, and syringe.
What therefore should be the basis for measurement goodness, if not comparing method performance to the mean or the theoretical concentration? The answer is simple: don’t evaluate a method relative to the mean, evaluate it relative to the product specification tolerance or design margin it must conform to. This concept has been well established for many years in chemical, automotive, and semiconductor industries and is recommended in the United States Pharmacopeia (USP) <1033> and <1225> (4, 5). Effectively the question is: how much of the specification tolerance is consumed by the analytical method? Finally, how does the method contribute to OOS events when releasing product to the clinic or market?
Method error should be evaluated relative to the tolerance for two-sided limits, margin for one-sided limits, and the mean or theoretical concentration if there are no specification limits (Equations 4–6).
Tolerance = Upper Specification Limit (USL) – Lower Specification Limit (LSL)
[Eq. 4]
Margin = USL – Mean or Mean – LSL (One-sided specifications)
[Eq. 5]
Mean = Average of specific concentrations of interest
[Eq. 6]
Direction from Guidance Documents
What do regulatory and standards organizations say about acceptance criteria for analytical methods? The following are brief quotes from the guidance documents regarding acceptance criteria:
• ICH Q2: Discusses what to quantitate, what to report, study design, and sample size. No mention of acceptance criteria is made in the standard, although it is implied there will be acceptance criteria generated (3).
• FDA, Analytical Procedures and Methods Validation for Drugs and Biologics (6): “An analytical procedure is developed to test a defined characteristic of the drug substance or drug product against established acceptance criteria for that characteristic. Early in the development of a new analytical procedure, the choice of analytical instrumentation and methodology should be selected based on the intended purpose and scope of the analytical method. Parameters that may be evaluated during method development are specificity, linearity, limits of detection (LOD), and limits of quantitation (LOQ), range, accuracy, and precision.”
• USP <1225>: “When validating physical property methods, consider the same performance characteristics required for any analytical procedure. Evaluate use of the performance characteristics on a case-by-case basis, with the goal of determining that the procedure is suitable for its intended use. The specific acceptance criteria for each validation parameter should be consistent with the intended use of the method” (5).
• USP <1033>: “The validation target acceptance criteria should be chosen to minimize the risks inherent in making decisions from bioassay measurements and to be reasonable in terms of the capability of the art. When there is an existing product specification, acceptance criteria can be justified on the basis of the risk that measurements may fall outside of the product specification” (4).
What are Method Elements that Need Acceptance Criteria?
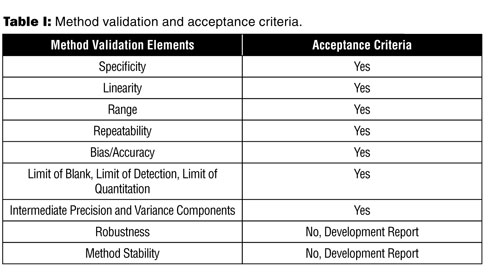
There are two elements for evaluating a method: determination of the result (bias, repeatability, etc.) and determination of the acceptance criteria for each element. The following is a summary of the elements that need acceptance criteria and what elements are ‘report only’ or need to be documented in a development report (see
Table I).
Recommended Acceptance Criteria for Specificity
There are two ways to show specificity:
• Identification, demonstrate it is measuring the specific analyte and not some other protein or substance
• Bias in the presence of interfering compounds or matrices.
Acceptance criteria should be similar to accuracy or bias as a % of tolerance:
Identification, 100% detection, report detection rate and 95% confidence limits
Reportable Specificity = Measurement – Standard (units) (in the matrix of interest)
Specificity/Tolerance *100, Excellent Results <= 5%, Acceptable Results <=10%
Recommended Acceptance Criteria for Linearity
Linearity is measuring the linear response of the method. The evaluation of linearity is minimally 80-120% of the product specification limits or wider. Acceptance criteria must demonstrate the method is linear within that range or higher. The following are techniques to demonstrate the method meets the minimum linear range of the method:
• Plot of the residuals and/or studentized residuals from a regression line
• No systematic pattern in the residuals through visual examination
• No statistically significant quadratic effect in a regression evaluation of the residuals correlated to the theoretical concentration.
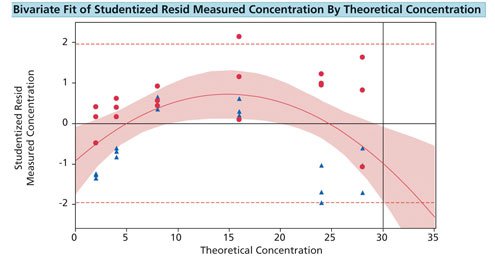
To set the limit of linearity, the following is recommended. Fit a linear regression line when correlating signal versus theoretical concentration. Save the studentized residuals from the curve. Add a line at +1.96 (95% sure the response is linear) and -1.96. Fit a quadratic fit to the studentized residuals. As long as the curve remains within +-1.96 of the studentized residuals, the response of the assay is linear. When the curve exceeds the 1.96 limit, one is 95% sure the assay is no longer linear. For Figure 1, one is 95% sure this assay is linear up to 30 ug/mL.
Recommended Acceptance Criteria for Range
Range is established where the response remains linear, repeatable, and accurate. Acceptance criteria for the range should be based on the following: Range of the method should be less than or equal to 120% of the USL and be demonstrated to be linear, accurate, and repeatable.
Recommended Acceptance Criteria for Repeatability
Repeatability is the standard deviation of repeated (intra-assay) measurements (see Figure 2). As repeatability error increases, the out of specification [OOS] rate increases. The following are the recommended evaluation and acceptance criteria. Repeatability as a percentage of tolerance should be used in the evaluation.
Repeatability % Tolerance = (Stdev Repeatability*5.15)/(USL-LSL), if two-sided spec limits
Repeatability % Margin = (Stdev Repeatability*2.575)/(USL-Mean) or (Mean-LSL), if one-sided
% RSD or CV = Stdev Repeatability/Mean*100, if no limits
Recommended acceptance criteria for analytical methods for repeatability are less than or equal to 25% of tolerance. For a bioassay, they are recommended to be less than or equal to 50% of tolerance.
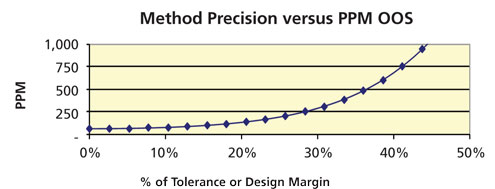
Figure 2: Influence of repeatability on capability (out-of-specification [OOS] rate in parts per million [PPM]). (Courtesy of author)
Recommended Acceptance Criteria for Bias/Accuracy
Accuracy or bias can only be evaluated once a reference standard has been generated. The average of the distance from the measurement-theoretical reference concentration is bias in units. Bias may be evaluated relative to the tolerance (USL-LSL), margin, or the mean:
Bias % of Tolerance = Bias/Tolerance*100,
Bias % of Margin = Bias/(USL-Mean or Mean – LSL) One Sided
Bias % of Mean = Bias/Mean*100
Recommended acceptance criteria for analytical methods for bias are less than or equal to 10% of tolerance. For a bioassay, they are recommended to also be less than or equal to 10% of tolerance.
Recommended Acceptance Criteria for LOD and LOQ
Acceptance criteria for LOD and LOQ should also be evaluated as a percentage of tolerance or design margin:
LOD/Tolerance*100, <=5% is Excellent and <=10% is Acceptable
LOQ/Tolerance*100, <=15% is Excellent and <=20% is Acceptable
If the specification is two-sided and the LOD and LOQ are below 80% of the lower specification limit, then the LOD and LOQ are considered having no impact on product quality determination and thus acceptable.
Recommended Acceptance Criteria for Intermediate Precision
Intermediate precision is the standard deviation of repeated measurements including both intra- and inter-assay sources of error. The following are the recommended evaluation and acceptance criteria. Intermediate precision (IP) as a % of tolerance should be used in the evaluation:
IP % Tolerance = (Stdev IP*5.15)/(USL – LSL), if two-sided spec limits
IP % Margin = (Stdev IP*2.575)/(USL-Mean) or (Mean-LSL), if one-sided limit
% RSD or CV = Stdev IP/Mean*100, if no limits
Criteria for IP % of tolerance or % margin: less than or equal to 25% Excellent, less than or equal to 30% Acceptable.
IP should be evaluated at each concentration, variance components for the intra- and inter-assay error should be reported (4) and IP % CV is report only.
Bioassay IP acceptance criteria: less than or equal to 60% of tolerance.
Reporting Robustness
A robustness study has no acceptance criteria; however, the robustness study should indicate the method is accurate and repeatable at the recommended best set point and across a defined range. It is expected that the robustness study will be used to determine settings and ranges that will ensure bias less than 10% of tolerance and repeatability less than 25% of tolerance.
Reporting Stability
A stability study on critical reagents such as standards and/or bulk materials has no acceptance criteria; however, the study should indicate the expiry of pre-mixes, bulks, or standards.
Using the Accuracy to Precision Profiler in Evaluating All Acceptance Criteria
For any method, the unique combination of product variation, product average, method accuracy, method repeatability, specificity, and stability all can be evaluated by a design space. The author has developed a SAS/JMP based tool (ATP Profiler) that can be downloaded to evaluate any method (7). The advantage is one can evaluate all of the dynamic elements of a specific method and determine the impact of the combined acceptance criteria on potential OOS rates (see Figure 3).
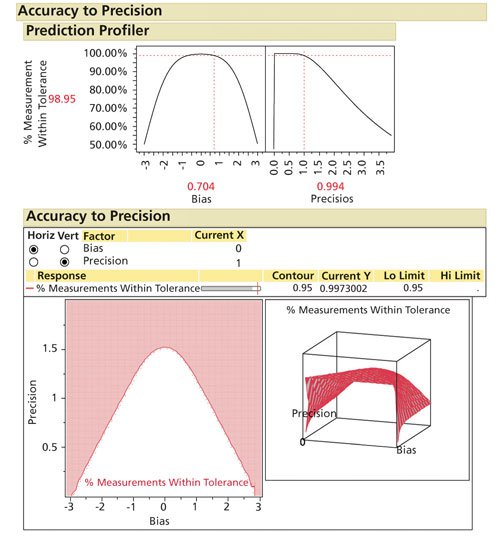
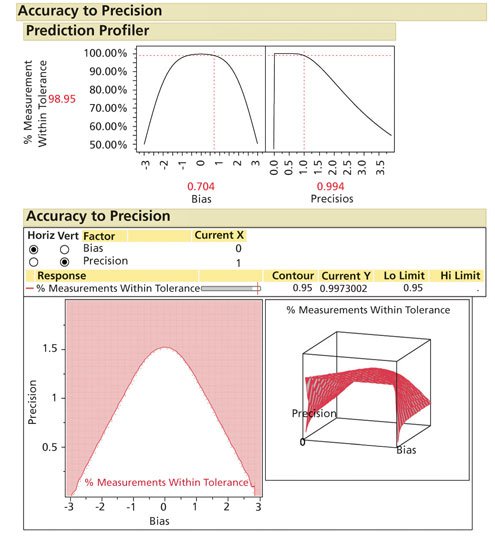
Figure 3: Accuracy to precision modeling. (Courtesy of author)
Summary and Conclusion
Moving from relative measures of analytical method goodness to measures that have product relevance links method performance to CQAs and their associated specification limits in a way that nothing else will. Knowing how method performance impacts OOS rates adds to better quality risk management and product knowledge. Setting acceptance criteria based on OOS rate impact is more meaningful and supported by both FDA and USP guidance. %CV and %Recovery should always be included in development reports and method validation documents as report only and should not form the basis of acceptance criteria.
References
1. ICH, Q6B Specifications: Test Procedures and Acceptance Criteria for Biotechnological/Biological Products (ICH, March 1999).
2. ICH, Q9 Quality Risk Management (ICH, 2006).
3. ICH, Q2(R1) Validation of Analytical Procedures: Text and Methodology (ICH, November 2005).
4. USP, <1033> Biological Assay Validation, USP 38 (USP, 2010).
5. USP, <1225> Validation of Compendial Procedures, USP 38 (USP, 2015).
6. FDA, Analytical Procedures and Methods Validation for Drugs and Biologics, Guidance for Industry (CDER, July 2015).
7. T. Little, Accuracy to Precision (ATP) Profiler.

