By: Clinton Weber, Ashok Kumar, Roland Ashton, Lisa Joslin, James Schmid, Michael Larson
From a CMO perspective, the traditional strategy behind process development has largely been to quickly identify target operational values that hit a primary quality target. This type of development strategy has been intended to generate at-scale product for clinical trials as fast as possible. The resultant operational ranges have traditionally been either very narrow because of lack of supporting experimental studies or statistically derived with little to no data from experimental design to support the outer ranges. Timelines are often built without an opportunity to identify crucial aspects of the process, perform range finding experiments, or optimize the process. Additionally, fears of making “process changes” within the clinical-manufacturing phase have prevented many processes from being more robust and operationally friendly. The resultant process-control strategy becomes narrow and/or possibly at risk of consistent excursions outside of the acceptable ranges. As molecules progress through the clinical phase and begin gearing up for commercial submissions, the amount of development and characterization may increase and many experiments must be repeated, adding to timelines and cost. Thus, by not following a well-defined development plan up front (i.e., a quality-by-design [QbD] approach), there is a potential increased risk of delaying commercialization.
Although the phrase QbD has been thought of as a new or borrowed concept and discussed in terms of feasability, many CMOs have been using these concepts, albeit perhaps not in a well-planned, cohesive manner. Now the discussion has turned to breaking down the reality of a QbD strategy. Implementing the infrastructure of a QbD approach to process development involves formalizing the commitment and the strategy and integrating execution into quality systems. The end result is a road map for the development of the product from the very beginning.
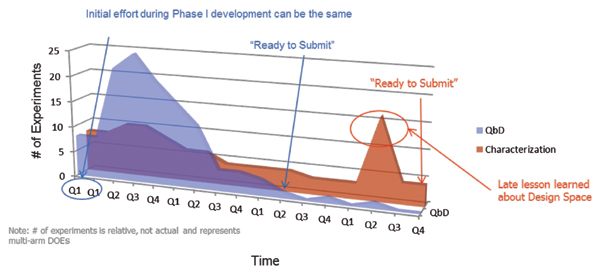
Figure 1 illustrates the difference in approaches. Both products are similar in complexity; therefore, the total knowledge required to be “ready to submit” (i.e., the area under the curve in Figure 1) is relatively constant between the two products. The timeline presented in Figure 1 represents time spent in product development at the CMO, not necessarily real time. What it does demonstrate, however, is that using the aforementioned QbD model, the CMO portion of the product commercialization is unlikely to ever be the bottleneck for a commercialization timeline. Additionally, the smarter portion of the QbD approach is minimizing redundant or inefficient characterization studies and reducing the risk of having to repeat characterization based upon late understanding of the process.
Program Steps Defined
TPP/QTPP. FDA’s 2007 draft guidance for industry defines TPP as a format for a summary of a drug development program described in terms of labeling concept (1). QTPP is defined in ICH Q8 (R2) as “a prospective summary of the quality characteristics of a drug product that ideally will be achieved to ensure the desired quality, taking into account safety and efficacy of the drug product” (2).
Assessment of knowledge. For each product under development, an initial assessment of available knowledge regarding the product and its function is assessed using various methods such as previous experience, literature information, consultants, and knowledge gap analysis. Efforts will be made to close the knowledge gap. This process helps in identifying the critical quality attributes (CQA) and is a joint effort between the client and the CMO.
CQA. CQAs are defined through execution of a risk assessment, which evaluates the impact of each product attribute on the safety and efficacy of the product. This is an iterative exercise conducted by key stakeholders from the product development team (CMO and client). Input from the clinical experts is critical for successful definition of CQAs.
Critical process parameters (CPP). Once CQAs are established, process parameters from each unit operation are evaluated to determine potential contribution or impact on those CQAs.
Design of experiments (DOE) and design space. Based upon an initial risk assessment and process evaluation, a structured experimental plan, designed for statistical analysis, begins. This analysis provides an understanding of how the process parameters and their interactions impact CQAs. Each CQA then serves as a dimension in the establishment of a multidimensional design space that provides a full understanding of process impact on product quality.
Process control strategy (PCS). A product developed using QbD principles will rely on manufacturing controls based on what is known to be crucial to the process. The PCS package results in a well-defined process with criticality understood and all process ranges justified with statistically significant data.
Continuous process verification (CPV). A good CPV program assures the process is under control and that any process drift in performance is detectable and can be proactively addressed.
Breaking Down the Critical Parts of Criticality
The first step begins with the generation of a target product profile (TPP) with safety and efficacy as central components. The main focus of QbD is to ensure that the elements of quality are incorporated into the design of the process and that the process consistently yields a safe and efficacious product. Product understanding with regard to safety and efficacy is limited at the beginning of the process unless the molecule in question belongs to a class of products already in use (e.g., as would be the case in the development of a biosimilar). Initial lack of information regarding the manufacturing process can be reduced to a certain extent based on experience, platform processes, and risk assessment exercises. The advantage of the CMO in this environment is the large breadth of experience and comparability tools available for the many diverse products using similar process steps.
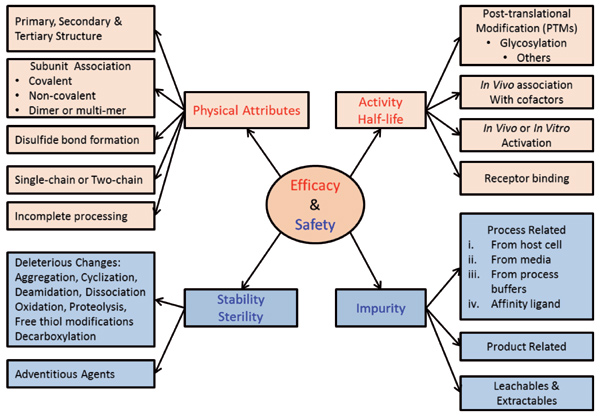
The first customized tool used in a QbD-based process development is the CQA risk assessment. CQAs are product attributes that have the most impact on the efficacy and safety of the product. At the beginning, this will be a preliminary list based upon the QTPP and might include a large number of attributes. As the product knowledge and the process knowledge increase, the number of CQAs might reduce. A tool shown in Figure 2 is used to initiate CQA determination from the TPP/QTPP. Information from literature, previous experience, subject matter experts, and consultants are used to generate the list of potential CQAs. A customized risk assessment tool (separate from the tool in Figure 2) takes into account “uncertainty” and “impact” of each CQA on safety and efficacy of the product. The preliminary list of CQAs helps prioritize which attributes to study further to understand and reduce uncertainty.
Establishing a Process Control Strategy
Once the initial design is in place, a process control strategy will be developed to ensure the process delivers a product that meets the CQAs.
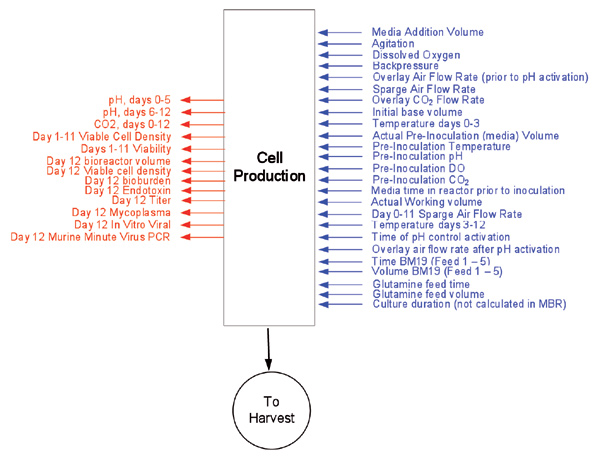
First, a P-Diagram (Figure 3) is generated per unit operation to identify all parameter inputs and outputs for each step. This tool is a good visual aid for process understanding and is also used to populate a customized risk-assessment tool called the Risk Assessment Mitigation Matrix (RAMM), as shown in Figure 4.
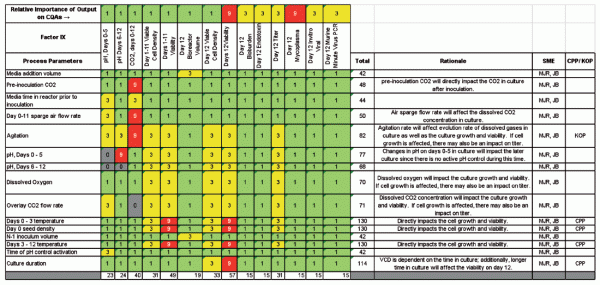
The RAMM tool is specifically designed to identify CPPs (3). This tool allows evaluation of what input parameters contribute the most variation to individual outputs. The outputs are scored on their potential to impact the CQAs. Scores are based upon three values, as shown in Figure 4 (1=green, 3=yellow, 9=red) to obtain separation and clearly identify criticality. The result of the analysis for each unit operation is a list of potential CPPs. The scores in each row are totaled to understand CPPs, and the scores in each column are totaled to understand an output’s influence on CQAs. Additional development experiments are then prioritized to complete the design space.
Smart DOE
A demonstrated understanding of the effects of CPPs and their interactions on CQAs is a requirement for an approved design space. Small-scale characterization experiments with appropriate experimental designs allow for a multivariate analysis including interactions, efficient use of data, and statistical modeling. Process characterization is often an iterative process involving parameter screening, range identification and response surface mapping. This method enables revisiting the original process development plans with the client to ensure that information gathered during early DOEs is understood and leveraged for future experiments. This is how risk is reduced and commercial timelines can be compressed. It also allows for iterations of the risk assessments.
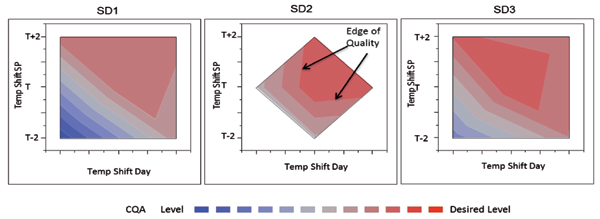
The following example shows an experiment designed to measure impact of seed density (SD), temperature shift degree, and day of temperature shift on an important CQA of a complex biologic. An on-face central composite design was employed in this experiment. The results are shown in Figure 5 along with a visual representation of the design space.
Conclusion
Following the CMC QbD Development Program allows definition of a design space earlier in the development program. This means that even the earliest development experiments can be built upon and leveraged as the product advances towards commercialization.
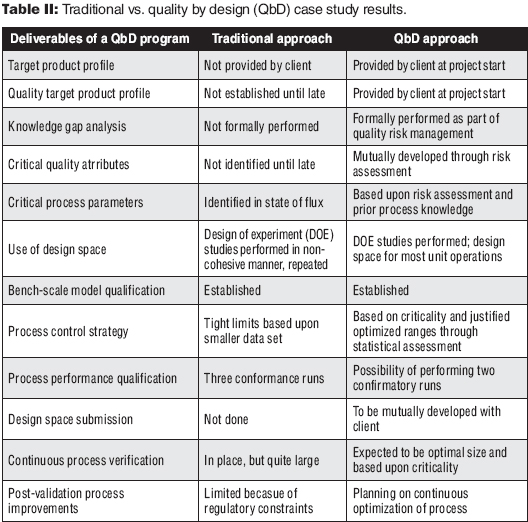
Table II contrasts the two different approaches and demonstrates the advantages of the QbD approach to development. The deliverables associated with the product lifecycle are more robust and timely. Additionally, the long-term support through the CPV program is optimal and flexible. As shown in Figure 1, the advantages can also represent a more robust timeline.
The QbD development program engages the client in a strategy to address critical issues pertaining to the product quality and the process early on. This necessitates a formal plan at the start of the development program, and both the CMO and the client need the commitment to do the work upfront. This strategy enables a seamless transition when the client and CMO push together for commercialization of the product.
Clinton Weber is associate director of BioProcess Sciences, Ashok Kumar is principal scientist, Lisa Joslin is process validation manager, and Roland Ashton, James Schmid, and Michael Larson are development associates, all in the Process Development Group at CMC Biologics, http://www.cmcbio.com/.
References
1. FDA, Draft Guidance for Industry: Target Product Profile—A Strategic Development Process Tool (Rockville, MD, Mar. 2007).
2. ICH, Q8 (R2) Pharmaceutical Development, Step 4 version (2009).
3. A. Brindle, et al., Pharm. Eng. 32 (1) 26, 28-33 (2012).


