
Quality-by-design principles can be used to understand chromatographic measurement system variability.
Sep 2, 2014
By: Melissa Hanna-Brown, Kimber Barnett, Brent Harrington, Tim Graul, Jim Morgado, Stephen Colgan, Loren Wrisley, Roman Szucs, Gregory Sluggett, Gregory Steeno, Jackson Pellett
Pharmaceutical Technology
Volume 38, Issue 8, pp. 48-64
The quality-by-design principles that enable a manufacturer to limit and control the sources of process variability are equally important to measurement systems, because the variability in any process is partly made up of the contributions of the measurement system variability used to understand the process. The authors use real-life examples from drug development projects to outline how an understanding of chromatographic measurement system variability might be achieved.
The concept of quality by design (QbD) was introduced to the pharmaceutical industry in the International Conference on Harmonization (ICH) guidance documents, ICH Q8-Q11 (1-4), as a way to develop robust manufacturing processes for pharmaceutical products and substances. The aim of these documents is to describe a framework for developing a deeper understanding of how variability in the parameters of a manufacturing process can affect the quality of the final product.
In 2010, the European Federation of Pharmaceutical Industries and Associations (EFPIA) Subteam on Analytical Methods introduced the concept of applying QbD principles to analytical methods (5) where they described two main objectives: improved method performance and increased regulatory flexibility. As yet, no pharmaceutical regulatory standards (analaogous to ICH Q8-Q11) exist that describe how to apply QbD principles to analytical procedures. This article, therefore, focuses on how QbD tools may be used to obtain improved chromatographic method performance in such a way that is aligned with holistic drug product and substance control strategies (regulatory flexibility will not be addressed here).
A QbD approach to understanding a measurement system such as a chromatographic method involves more than the demonstration of a depth of understanding regarding the choice of chromatographic separation parameters (e.g., through multifactor experimental design/robustness studies). Instead, to comprehensively follow QbD principles, the process should start with a statement of method design intent incorporating method performance characteristics focused on the minimum quality standard of the data the method must achieve so as to be fit for purpose. The foundation of a QbD method is, therefore, a fundamental understanding of the requirements of what the method needs to measure and the reliability requirements to which the method will be judged so as to produce data in compliance with a minimum quality standard. In other industries, the understanding of data “quality” is commonly communicated through an expression of the “uncertainty” associated with a measurement “result”. This uncertainty is treated with equivalent importance to the result itself (as it gives confidence in the quality of the measurement result and facilitates understanding in situations in which, for example, pass/fail criteria with respect to specification limits are being assessed). The concepts regarding how to express the uncertainty associated with a measurement data result can be found in many publications focused on measurement uncertainty (6-13).
In the pharmaceutical industry, the approach to understanding the uncertainty associated with measurement results is being addressed under analytical QbD principles. Here, the design of method performance characteristics is the foundation for ensuring measurement data quality can be rigorously controlled. In line with this, the EFPIA subteam introduced the concept of the analytical target profile (ATP) (5), which describes the performance characteristics of the method such that data the method produces will be “fit for purpose” (e.g., for making decisions about whether a batch of drug substance or drug product meets the specification criteria for assay or purity).
Once an ATP has been defined, a systematic process follows that includes a focus on design of the method (i.e., choice of technique and drafting of suitable starting conditions) followed by a full evaluation of the method using risk assessment tools and multifactorial experimental approaches. The final step focuses on an expression of the method conditions or ranges across which the ATP may be met, together with specific instructions to ensure adequate control of the method each time it is used. This process is holistically defined in the schematic in Figure 1. It is important to note that it is not a one-time process but instead is an iterative one that should be revisited throughout the lifecycle of a method. Risk assessments or experiments performed against the ATP should be made each time any change to the product or process is made or new knowledge is gained.
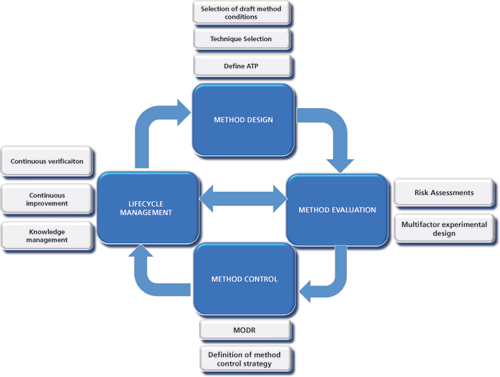
Figure 1: Enhanced science and risk-based tools and approaches used to develop a quality-by-design analytical method. ATP is analytical target profile. MODR is method operable design region.
Method design
As outlined previously, the first step in QbD method development is to define the ATP. There are at least three important components to be included in this statement:
- The range for which the analytical method is expected to quantify the measurand (i.e., analyte)
- The total uncertainty, expressed in terms of systematic (accuracy) and random (precision) uncertainty (i.e., variability) components
- A description of the analyte to be tested, including the sample or matrix in which it will be tested.
Accompanying the second consideration, the level of risk should be understood for making incorrect decisions.
The following discussion outlines ATPs for a combined assay and purity method for a real-life drug substance, referred to henceforth as examplain hydrochloride (HCl):
- Assay: The procedure must be able to accurately quantify examplain HCl drug substance over a range of 90% to 110% of the nominal concentration with accuracy and precision such that measurements fall within ±2.0% of the true value with at least a 95% probability.
- Purity: The procedure must be able to accurately quantify all related impurities relative to examplain HCl in the presence of drug substance and other impurities over a range from the reporting threshold through twice the specification limit. The accuracy and precision of the procedure must be such that the measurements fall within ±15% of the true value for impurity levels ≤ 0.15% with at least 90% probability and within ±10% of the true value for impurity levels > 0.15% with at least 90% probability.
Justification of ATP statements. Assay ATP. The ATP describes method performance requirements that define the risk of making an incorrect decision concerning the measurand (14). Analytical methods that adhere to the criterion stated in the ATP allow decisions (e.g., to accept or reject a batch based on the reported value) to be made based on a predefined, maximum level of risk, which is particularly important when the reported value is near the specification limit. For instance, a method that conforms to the assay ATP discussed previously will produce measurements for which there exists at least 95% confidence that these measurements reside within ± 2% of the true (unknown) measurand. That is, there is no more than a 5% chance of making an incorrect decision against the stated bounds of ± 2%.
Suppose a potency result of 100% label claim for a release test of a particular lot is measured. Further, suppose the analytical method used to obtain this result has been shown to conform to the ATP discussed previously. The risk that the true, unknown potency of the lot is below the specification limit of 98% is less than 5%, because the method conforms to the statement that at least 95% of measurements will reside within ± 2% of the true value. Consequently, there exists less than a 5% chance that the true unknown value differs by more than 2% from the observed measured value (95% confidence true value within 100% ± 2% or 98-102%).
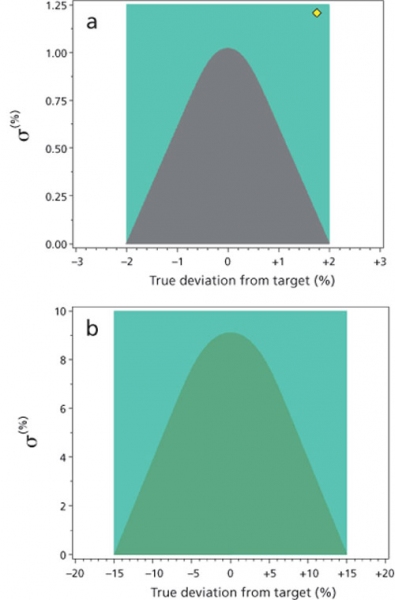
Figure 2: Representation of the analytical target profile (ATP) for (a) assay and (b) purity determination of an example substance using the probability curve approach (grey parabolic curve) where bias and precision are interdependent compared to the traditional acceptance criteria (green rectangle) where accuracy and precision are treated separately.
The specification criteria for the assay is 98-102% label claim. It should be noted that the initial assay specification was 97.0-103.0%, and the ATP was established based on this orginal specification. The specification was subsequently tightened to 98.0-102.0% based on global regulatory feedback, and the original ATP was found to be fit for purpose with respect to the revised specification. The ATP criteria, as with ICH method validation criteria, are established based on considerations for patient safety and product quality and are consistent with the capability of analytical methodology used to characterize APIs. Figure 2a illustrates pictorially the ATP as a probability contour plot (i.e., parabolic region in dark grey) for the examplain HCl drug substance assay as described. Here, the total uncertainty is comprised of precision (σ, random variability) and bias (μ, systematic variability). Figure 2a also illustrates a rectangular region corresponding to the more generally applied acceptance criteria established for analytical measurements, in which bias and precision are defined independently. In this case, the rectangle represents the following method criteria: the measurement has no more than ± 2.0% bias and no more than 1.25% variability.
Several items are notable in Figure 2a. First, the probability curve (parabolic region in dark grey) is contained within the more generally applied acceptance criteria (rectangular region in green). As such, the ATP criteria are slightly more restrictive. Second, when using the probability curve approach, method precision criteria (y-axis) is dependent on bias criteria (x-axis) and vice versa. This is because the total uncertainty, which is specified in the ATP, is a combination of these two components. Intuitively, a method with no bias can accommodate more variability (or lower precision) compared to a method with some non-negligible bias while providing the same total uncertainty. As method bias increases towards the ATP limit (±2 in Figure 2a), the required method variability decreases to zero to maintain the same analytical performance in terms of total uncertainty. When using the traditional approach of independent bias and precision assessments, there is no natural trade-off between those criteria, thus implying that a method may have both high bias and high variability (indicated by the yellow diamond in the upper right-hand corner of the green rectangle in Figure 2a), which could be problematic if not properly linked to the specification range. That is, a method operating at the yellow diamond (bias approximately + 2% and precision approximately 1.25%) does not maintain a 95% assurance that measurements will be within ± 2% of the true value. If the bias can not be corrected for, then measurements have only approximately a 50% chance of being within ± 2% of the true value. Even if this method is corrected for a known 2% bias (i.e., bias can be measured as different from random uncertainty), there exist < 90% probability that measurements will reside within a ± 2% range.
The expression for defining the acceptance region is shown in Equation 1:

Equation 1
where µ is true mean/accuracy (a parameter); σ is true sigma/precision (a parameter); e is allowable analytical window (a fixed constant); y is individual assay value (a random variable with mean µ and standard deviation σ); T is true analytical content (fixed target); p is minimum probability for individual assay to reside within error bound e (fixed constant); ϕ is normal density function centered at µ, with standard deviation σ.
Using Equation 1, the interplay between the appropriate analytical window (e), maximum sigma (σ), and minimum probability (p) can be probed for each unique analytical method.
Purity ATP. In this example, the specification criteria detail the limits for all related (specified) impurities to examplain HCl with specified impurities A and B both with limits of not more than 0.15%.
Figure 2b illustrates the ATP as a probability contour plot for the examplain HCl drug substance impurities as described previously (i.e., parabolic region in dark grey). The total uncertainty is comprised of precision (σ, random variability) and bias (μ, systematic variability).
Figure 2b also illustrates a rectangular region corresponding to the more generally applied acceptance criteria established for analytical measurements, where bias and precision are defined independently. In this case, the rectangle represents the following method criteria: the measurement has no more than ± 15.0% bias and no more than 10% variability. Here, the maximum allowable bias and precision is consistent with what can be expected for analytical procedure performance at these levels. For example, for levels ≤ 0.15% relative to examplain, the maximum allowable precision is 9.1% RSD and the maximum allowable bias is ± 15%.
There is a trade-off between precision and accuracy, such that it is not acceptable for the method to exhibit maximum bias and maximum variability concurrently, and, as with the assay ATP, the purity ATP criteria is slightly more restrictive when compared to the ICH validation criteria that would have typically been applied. From a practical perspective, the ATP criteria can be interpreted as follows: 9 out of 10 measurements will fall within 100% ± 15% of the true value, which corresponds to a range in which at least 9 out of 10 measured values will reside within 0.13% to 0.17%. This level of measurement uncertainty ensures patient safety. It is consistent with the philosophy of ICH Q3A (Impurities in New Drug Substances) as well as the current capability of contemporary analytical methodology used to quantitate low-level impurities in pharmaceutical drug substances. In fact, contemporary method capability was taken into consideration when the limits in ICH Q3A were established.
Analogous statements can be made for ATP criteria for impurities > 0.15% where the maximum allowable precision is 6.1% RSD and maximum allowable bias is ± 10%. This means that an impurity present at 0.3% (true value) corresponds to a range in which at least 9 out of 10 measured values will reside within 0.27%- 0.33% (i.e., true value ± 0.1 x true value). This tiered approach ensures that performance of the procedure is maintained for higher level impurities while ensuring patient safety and aligning with contemporary procedure capability.
Technique selection. Once appropriate ATP criteria have been established, a technique should be selected. This selection depends not only on the match between measurement technique capability and ATP, but also on other scientific, practical, and business requirements. Typical considerations to bring to the discussion table between scientists who may be involved in using the method across the development lifecycle could include the physicochemical characteristics of the molecules in question, whether the method will be run in an R&D environment or a manufacturing environment, if on-line capability might be required, what sample turn-around times (from sampling to data reporting) are going to be necessary, and a plethora of other scientific and business-focused factors.
In the case examples discussed in this article, following such a discussion between R&D and receiving laboratory analytical scientists, reversed-phase high-performance liquid chromatography (RP-HPLC) was the method of choice.
Systematic method development. Once a technique has been chosen, a systematic process to arrive at “starting” or “draft” method conditions should be followed. In the case of RP-HPLC, the approach is shown in Figure 3. Here, experimental studies are combined with in-silico modeling software to maximize the value of the results by being able to predict between experimental parameters (15, 16).
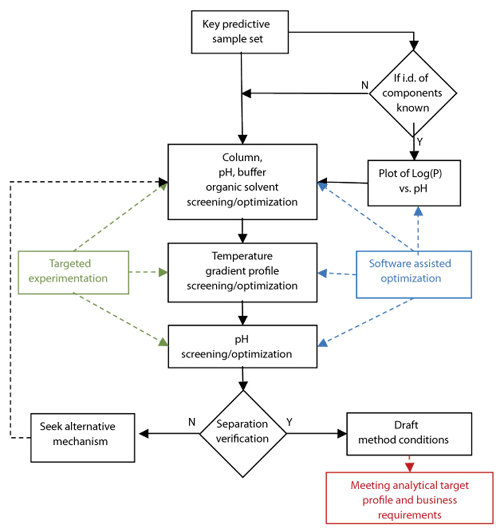
Figure 3: Representation of a systematic approach to reversed-phase liquid chromatographic method development.
At the start of the process, it is essential to define the correct key predictive sample set (KPSS). For a pharmaceutical example, the KPSS available will be highly dependent on the drug-development lifecycle stage, and the ideal KPSS for an API purity method should include all known process related impurities and known relevant potential degradants. If structures are known, then the experimental screening strategy may be supplemented by the information to be gleaned from a Log(P) vs. pH plot (P is the octanol water distribution coefficient of all analytes of interest). The column screening strategy employed in our laboratories and for the examples discussed here encompasses four stationary phases; two organic solvents; and acidic, neutral, and basic aqueous mobile phases (15). The primary objective of the screening is to obtain the most promising starting conditions with respect to overall selectivity, peak shape, and chemical stability, as well as minimal reliance on accurate pH control.
The next step is to investigate the combined effects of temperature and gradient profile using the starting conditions from the first phase of screening experiments (i.e., stationary phase, pH, and organic modifier). This experiment aims to explore the impact of various gradient profiles together with a range of temperatures across six experiments. The data obtained are modeled using software (e.g., ACD Labs LC Simulator), which allows the scientist to interpolate or extrapolate beyond the tested range to gain maximum value from a relatively low number of experiments. In the example, the data from the six experiments are used as the input for in silico optimization experiments. The result is a resolution map and optimized chromatogram within which the optimum conditions with respect to overall peak shape, resolution, and analysis time may be predicted (Figure 4).
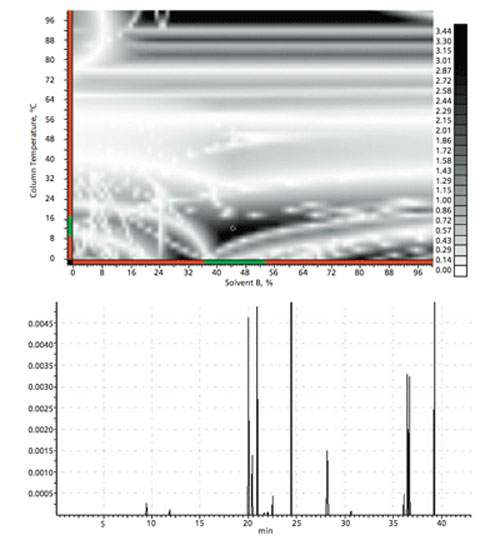
Figure 4: Example output of the in silico optimization of temperature and gradient profile.
The final stage of this systematic approach to method development is to check the effect of small changes in pH on the method performance. The pH is typically varied by up to +/- 1.0 pH units across five experiments (e.g., +1.0, +0.5, 0, -0.5, -1.0 pH units). Again, the data resulting from these experiments may be evaluated using software packages, such as the LC Simulator software, which allows for a more thorough understanding regarding the most suitable pH that will yield a more robust separation.
Experience with this systematic approach to method development indicates that approximately 75% of all applications lead to a successful (i.e., fit for purpose) method. In the remaining cases, various degrees of variations from the workflows have to be explored. For example, use of alternative buffer components, ion-pairing reagents, alternative column chemistries, and even completely different separation mechanisms can be applied.
Method evaluation
Risk assessment. The risk-assessment exercise involves a systematic assessment of the draft method. The risk assessment process is designed to map individual method steps (e.g., standard and sample preparation or chromatographic separation) and identify method variables with the potential to affect method performance with respect to the ATP requirements. In the case described here, this exercise involved experienced analytical chemists from the method development and receiving laboratories and included those with some experience running the method. These participants were included to ensure that knowledge from previous studies were included and to understand differences in lab practices between the development and receiving laboratories. Three distinct focus areas were examined: (1) sample and standard preparation; (2) chromatographic separation; and (3) detection and data processing. Method variables were scored based on their potential to affect method performance together with the likelihood of occurrence using a cause-and-effect Matrix. Each variable was categorized as follows:
Experimental (X). Those that may vary and require further experimentation to understand (e.g., temperature, flow rate, mobile phase composition)
Controlled (C). Variables that can be controlled or specified at unique levels (e.g., column stationary-phase type and particle size, column diameter, length, and supplier)
Noise (N). Those that cannot be controlled or are allowed to vary randomly from a specific population (e.g., column age).
Method variables with the highest scores (i.e., combined high probability and high impact on chromatographic performance relative to the ATP) were further assessed by way of multifactor experimentation. An example of the multifactor experimentation from the chromatographic separation focus area follows.
Multifactor experimental design. Two separate design-of-experiments (DoE) studies were performed to identify and verify the optimum method conditions. The first DoE was conducted to explore and identify a preliminary set of chromatographic conditions for further verification. The second DoE was conducted to verify conformance of the method to the ATP criteria.
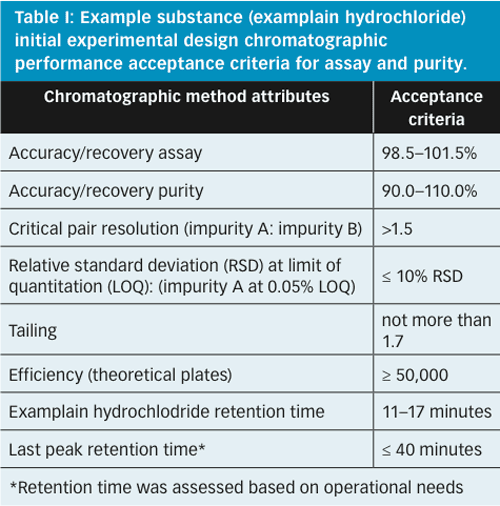
Figure 5 represents the experimental region from the first wave of experimental design studies (DoE-1). This design included the following parameters which were identified during the risk assessment as having the highest potential to influence the chromatographic separation: flow rate, trifluoroacetic acid (TFA) content in mobile phase, column temperature, gradient change, and start and end times. A preliminary set of suitable operating conditions was identified by assessing the chromatographic performance measured during DoE-1 against the predefined criteria shown in Table I.
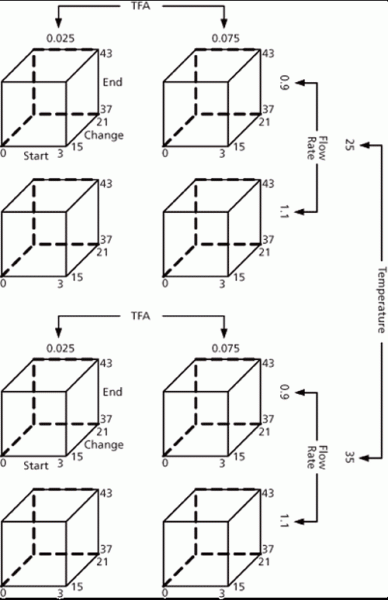
Figure 5: Experimental design for assay and purity of example substance.
The results of DoE-1 were used to identify the variables that may affect chromatographic performance. Statistically significant effects at the commonly-accepted 0.05 level of statistical significance were determined using Student’s critical t-values. Statistical models of these results were developed for each method attribute and used to define the variable ranges over which the method is expected to meet the predefined criteria in Table I. These ranges of chromatographic variables defined a preliminary experimental design space referred to as the method operable design region (MODR).
A subsequent experimental design study (DoE-2) was executed to verify that the method complied with the criteria specified in the ATP. Verification testing was performed using experimental conditions spanning the preliminary predicted MODR identified from DoE-1 results. Based on the data analyses from DoE-1, the three parameters that had the largest collective impact on both resolution and limit of quantitation (LOQ) were the gradient change time, the column temperature, and the mobile phase TFA concentration. To select the method conditions, a standard 23-1 design was chosen that spanned a predicted acceptable range of method performance. Specifically, the gradient start time was varied between 15-19 minutes, the column temperature between 25-32 C, and TFA content between 0.04-0.06%. The other parameters that had an impact on method performance were flow rate and gradient start time. For this experiment, however, those levels were fixed at values that would stress the system in terms of performance; that is, at levels nearing the predefined criteria. Flow rate was set at 1.05 mL/min and gradient start time at 0.5 minutes. Gradient end time did not affect method performance. Testing was conducted over four days, by two analysts, in two different laboratories (development and testing labs) using HPLC systems from two vendors (Agilent and Shimadzu).
The chromatographic variables used to verify the MODR are shown in Figure 6. Verification testing was initially performed using conditions 1-4. Figure 6a and 6b show how results using conditions 1, 3, and 4 all met ATP criteria. Results generated using condition 2, however, failed to adequately meet ATP criteria due to insufficient resolution (Rs < 1.0) for the critical pair. This is illustrated in Figure 6a where condition 2 is clearly within the red shaded region. As a result of this failure, the MODR model was refined, and a new combination of verification variables, condition 5, was added.
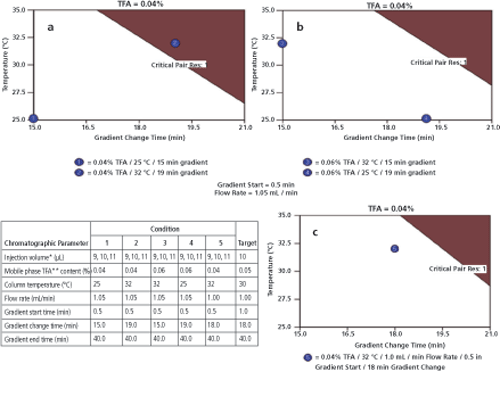
Figure 6: Assay method operable design region (MODR) verification conditions and results. In (a) and (b), initial results where condition 2 is seen to “fail” and in (c), final results using verification condition 5; TFA is trifluoroacetic acid.
In lieu of preparing separate solutions, injection volumes of 9, 10, and 11 µL were used to verify conformance to the ATP over the range of 90-110% of the nominal injection concentration. The flow rate was held at 1.05 mL/min for the original verification study (conditions 1–4), as a flow rate slightly above the 1.0 mL/minute target was considered a worst case scenario based on the results from DoE-1. The flow rate was changed to 1.00 mL/min (the target condition) for condition 5. The final verified MODR incorporating verification condition 5 is illustrated in Figure 6c.
As a means of visualising how these results from both labs during DoE-2 comply with the ATP, Figure 7a shows the probability contour plot (using Equation 1) illustrating method variability (σ≈relative standard deviation or RSD) vs. calculated bias/process acceptance criteria (98-102% potency). The grey-shaded region is the graphical representation of the ATP criteria for the assay method. Each point represents 24 replicates at each of the five MODR verification parameters run in the two different labs. This graph illustrates minimal (statistically insignificant) bias relative to the proposed 98.0-102.0% assay acceptance criteria. Although slightly greater variability was observed for Lab 2 results, all results fall within the ATP for the assay method (grey region). The triangular regions surrounding each point represent the simultaneous 95% confidence interval for accuracy and precision for each of the points as described in Lindgren’s Statistical Theory (14).
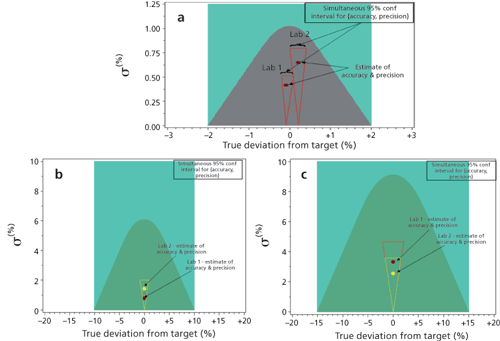
Figure 7: (a) Probability contour plot illustrating the analytical target profile (ATP) assay criteria in terms of accuracy (x-axis) and precision (y-axis) (shown in grey). (b) Probability contour plot for Impurity A at levels > 0.15% illustrating the ATP purity criteria in terms of accuracy (x-axis) and precision (y-axis) (shown in dark green). (c) Probability contour plot for Impurity B at levels ≤ 0.15% illustrating the ATP purity criteria in terms of accuracy (x-axis) and precision (y-axis) (shown in dark green). In a-c the two points represent combined results for two separate laboratories.
Similarily, the probability contour plots in Figure 7b and Figure 7c illustrate method variability (σ≈ RSD) vs. calculated bias/process acceptance criteria for results generated from both laboratories for impurity A at > 0.15% and impurity B at ≤ 0.15%, respectively. Each point represents 24 replicates at each of the five DoE conditions run in the two different labs. The simultaneous 95% confidence interval for accuracy and precision is also shown on the plots. These results illustrate how impurity A and B quantitation data meets the ATP criteria for quantitation of impurities in that > 90% of data are within ± 10% of expected normalized value for values > 0.15%, and > 90% are within ±15% of the expected normalized value for values ≤ 0.15%.
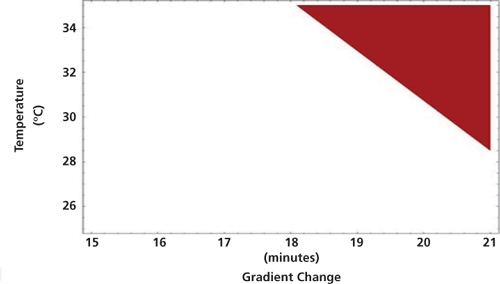
Figure 8: Final verified method operable design region (white region) for the example drug substance assay/purity method.
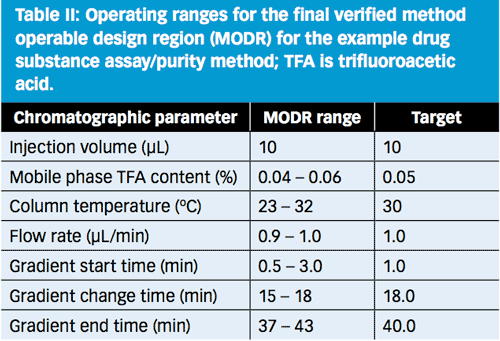
Based on the statistical modelling from DoE-1 and DoE-2, the entire white region in Figure 8 is predicted to be capable of meeting the ATP acceptance criteria. For operator simplicity, however, the operating ranges were constrained to the ranges listed in Table II.
Method control
The final stage of the development of the method involves establishing a meaningful control strategy that, when executed, ensures the method is capable of producing data compliant with ATP criteria. The concept is analogous to system suitability and involves consideration of method variables that could affect the ability of final results to meet ATP criteria. In contrast to traditional practices, however, the control strategy is clearly linked to ATP criteria and is established based on a rich data set, including data collected during more rigorous method development and multifactor experiments. This strategy enables a more relevant correlation to be established between the method variables and performance, such that adherence to ATP criteria is maintained over the lifecycle of the method.
The following method attributes were observed to be crucial to ensure the method is capable of meeting the ATP at the time of use:
- Resolution of > 1.0 between the critical pair (impurity A and B)
- Injection precision (% RSD)
- Assay: ≤ 0.85% RSD (n=6) for examplain HCl at nominal assay concentration
- Purity: ≤ 10% RSD (n=6) for impurity A at 0.05% of nominal assay concentration
- LOQ: 0.05%, confirmed using injection precision criteria for purity.
The overall measurement uncertainty, which is constrained by the ATP criteria, is composed of both systematic (bias or accuracy) and random (precision or variability) components. Two precision components associated with the method that contribute to the total variance at the time of use are presented in Equation 2.
Equation 2
For this example, total variance is the sum of the instrument, sample preparation variability, and standard preparation variability. Based on information collected during the development and verification of the MODR, standard and sample preparation variability individually contributed ≤ 0.5% to the total variability. Controlling injection precision to ≤ 0.85%, along with a maximum contribution of 0.5% for sample precision, ensures that the operational variability will be minimized and aligned with ATP criteria.
Continuous verification. The purpose of continuous verification is to ensure that through the lifecycle of a method there is a strategy by which assurance can be gained that the measurement data quality remains within the requirements of the ATP and, as such, ensures that the method is under control. Verification would typically include routine monitoring (e.g., control charts of the measurement procedure). Such close monitoring of the measurement procedure every time it is run would allow for close control of the method and may lead, over time, to refinement of the method control strategy or indeed the MODR itself. This approach allows for continual improvement of the method. It is important to note that to be successfully adopted in an industrial environment where multiple laboratories may be using a method, a robust knowledge management system must be in place which transparently provides up-to-date information on the most current status of the method control strategy and MODR.
Conclusion
This article outlines a possible strategy which might be used to gain an enhanced depth of understanding about a chromatographic method as applied to an assay/purity method in a pharmaceutical setting. Although such an approach is more resource-intensive than a traditional method development exercise, the advantages of data quality, superior method control, and enhanced confidence in decisions made using data derived from such a method across its lifecycle are significant enough to warrant adoption.
Reference
1. ICH, Q8 (R2). Pharmaceutical Development (2009).
2. ICH, Q9. Quality Risk Management (2005).
3. ICH, Q10. Pharmaceutical Quality System (2008).
4. ICH, Q11. Development and Manufacture of Drug Substances (Chemical Entities and Biotechnological/Biological Entities) (2012).
5. M. Schweitzer, et al., Pharm. Technol. Eur. 22 (2) 29-37 (2010).
6. V.R. Meyer. J Chromatogr. A. 1158, 15-24 (2007).
7. BIPM, JICM 100: Guide to the expression of uncertainty in measurement (GUM), (2008).
8. S.L.R. Ellison, M.Rosslein, and A. Williams (Eds.), ‘’Quantifying Uncertainty in Analytical Measurement,’’ in Eurachem/CITAC Guide (3rd ed.).
9. ISO, ISO 21748:2010, Guidance for the use of repeatability, reproducibility and trueness estimates in measurement uncertainty estimation (Geneva, 2010).
10. ISO, ISO/IEC 17025:2005, General requirements for the competence of testing and calibration laboratories (Geneva, 2010).
11. M. Feinberg, et al., Anal. Bioanal. Chem. 380 (3) 502-514 (2004).
12. W . Horwitz and R. Albert. Analyst. 122 (6) 615-617 (1997).
13. J. Wallace. Sci. & Justice. 50 (4) 182-186 (2010).
14. B.W. Lindgren, Statistical Theory (Chapman and Hall, 4th ed, 1993).
15. R. Szucs, et al., ‘’Pharmaceutical Analysis,’’ in Liquid Chromatography: Fundamentals and Instrumentation, S. Fanali, P.R. Haddad, C.F. Poole, P. Schoenmakers, and D. Lloyd, Eds. (Elsevier, Amsterdam, 2013), pp 431-453.
16. G. L. Reid, et al., J. Liq. Chromatogr. Relat. Tech. 36 (18) 2612-2638 (2013).
About the Authors
Melissa Hanna-Brown Analytical R&D scientist at Pfizer, Sandwich, Kent, UK, melissa.hanna-brown@pfizer.com, tel. +44 1304 642 125
Roman Szucs, Analytical R&D at Pfizer, Sandwich, Kent, UK
Kimber Barnett, Analytical R&D scientist, Pfizer, Groton, Connecticut, US
Brent Harrington, Analytical R&D scientist, Pfizer, Groton, Connecticut, US
Tim Graul, Analytical R&D scientist, Pfizer, Groton, Connecticut, US
Jim Morgado, Analytical R&D scientist, Pfizer, Groton, Connecticut, US
Steve Colgan, Analytical R&D scientist, Pfizer, Groton, Connecticut, US
Loren Wrisley, Analytical R&D scientist, Pfizer, Groton, Connecticut, US
Gregory Sluggett, Analytical R&D scientist, Pfizer, Groton, Connecticut, US
Gregory Steeno, Analytical R&D scientist, Pfizer, Groton, Connecticut, US
Jackson Pellett, Analytical R&D scientist, Pfizer, Groton, Connecticut, US

